
Capture price dashboard for solar and wind
What capture price means, how it is calculated, and what you can explore in the live dashboard for solar and wind.
What is capture price?
Capture price is the average market price actually realized by a generating technology—such as solar or wind—over the periods when it produces power. Unlike the simple day-ahead or spot price average, capture price weights each market interval by the asset’s generation in that interval. This reflects how prices vary throughout the day and how each technology’s production profile aligns with those price movements.
The capture factor is a dimensionless ratio comparing capture price to the market’s average price over the same period. Roughly: capture factor = capture price / average market price. Values above 1.0 indicate outperformance versus the market average; values below 1.0 indicate underperformance.
Why it is important
Capture price measures revenue quality beyond headline market prices. It captures cannibalization effects - for example when mid-day solar generation depresses prices during peak production hours. It is also useful for portfolio valuation, PPA benchmarking, and hedging analysis.
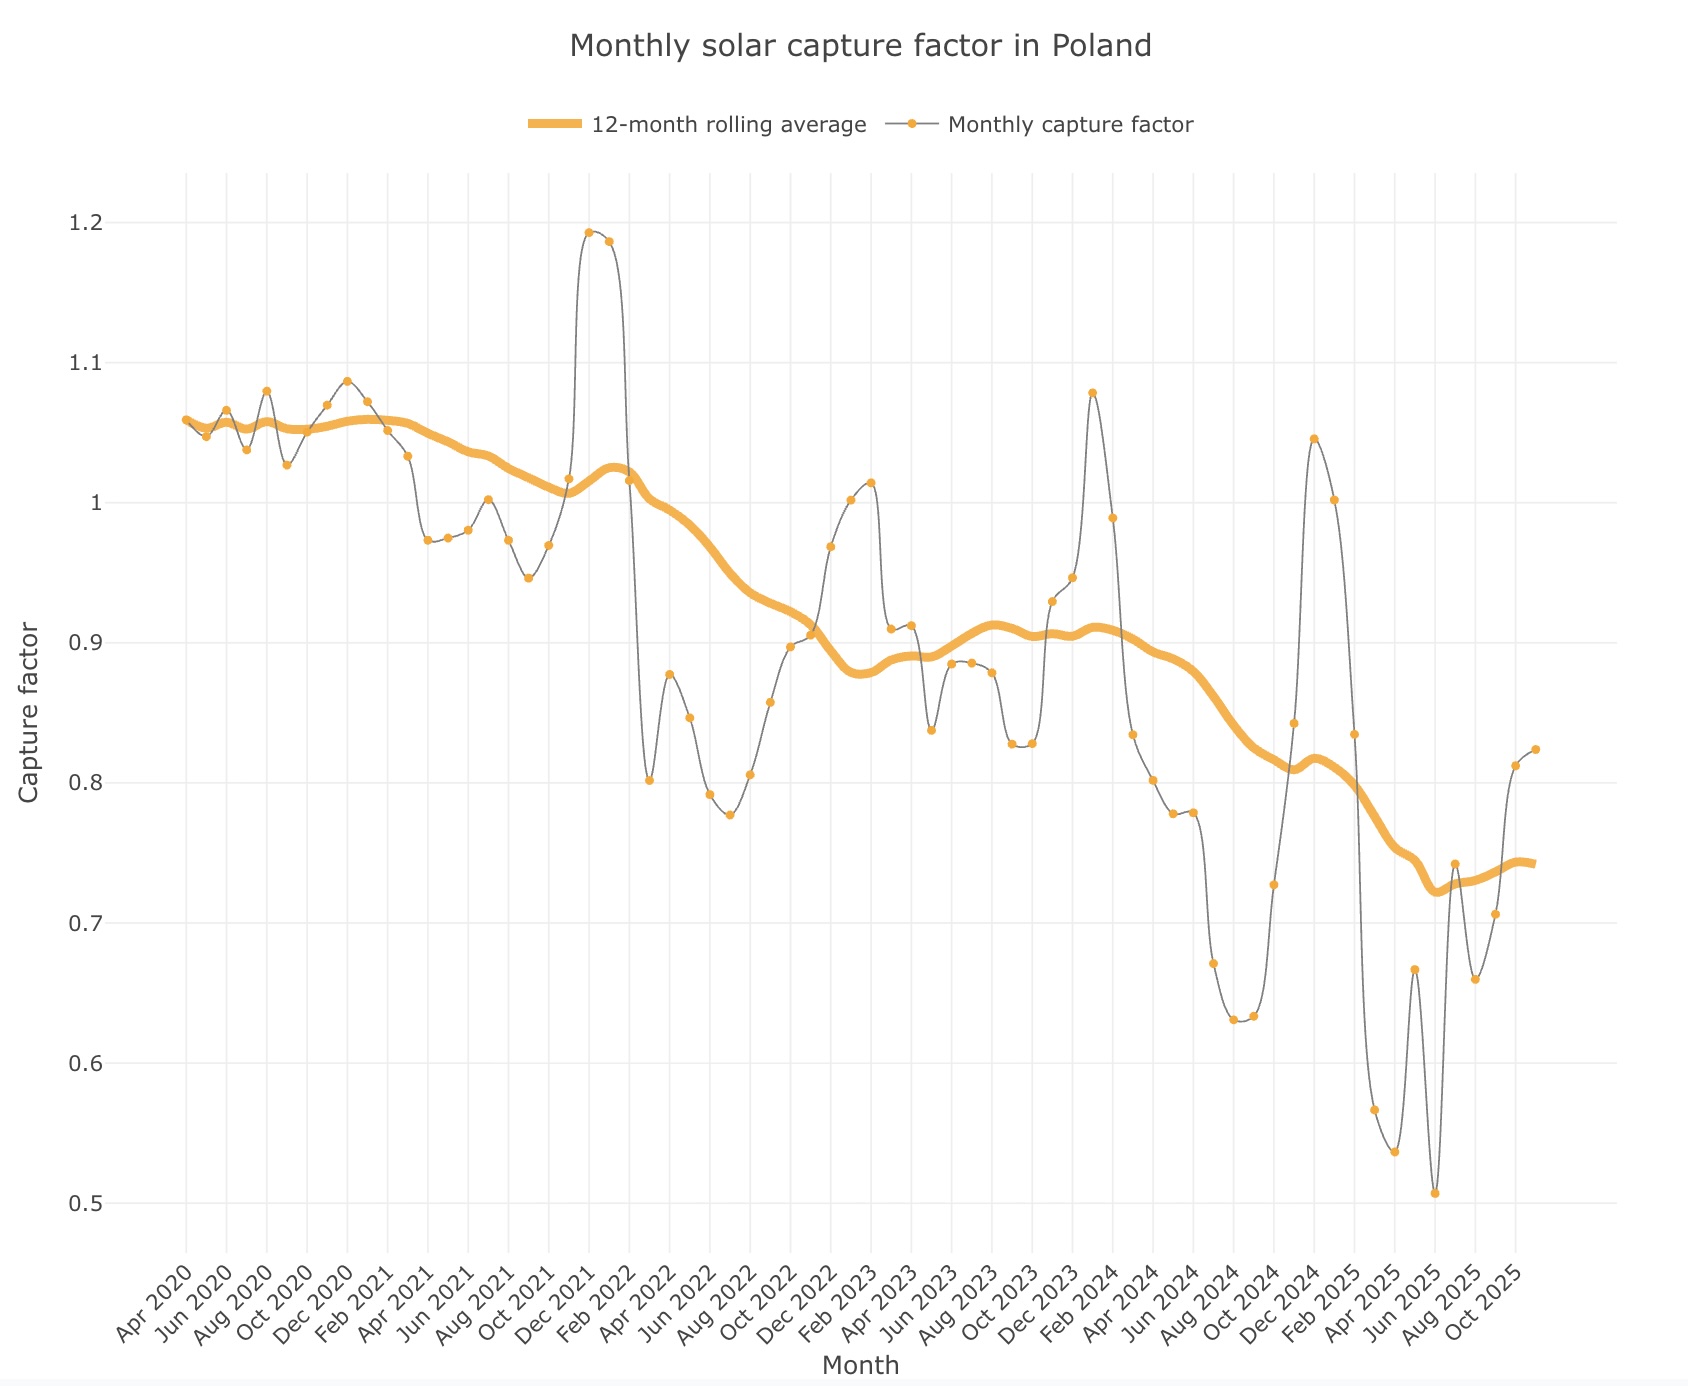
What’s in the dashboard
The live dashboard provides hourly time series for two variables: PV capture factor and wind capture factor. Data coverage:
- Temporal coverage: 2020-04-01/2025-10-31
- Region: Poland